🎲 Exploring Probability with a Monte Carlo Dice Simulation
Monte Carlo simulations are a fascinating way to understand probability and randomness. I built a Monte Carlo Dice Simulation to help visualize these concepts in real time. You can check it out here:
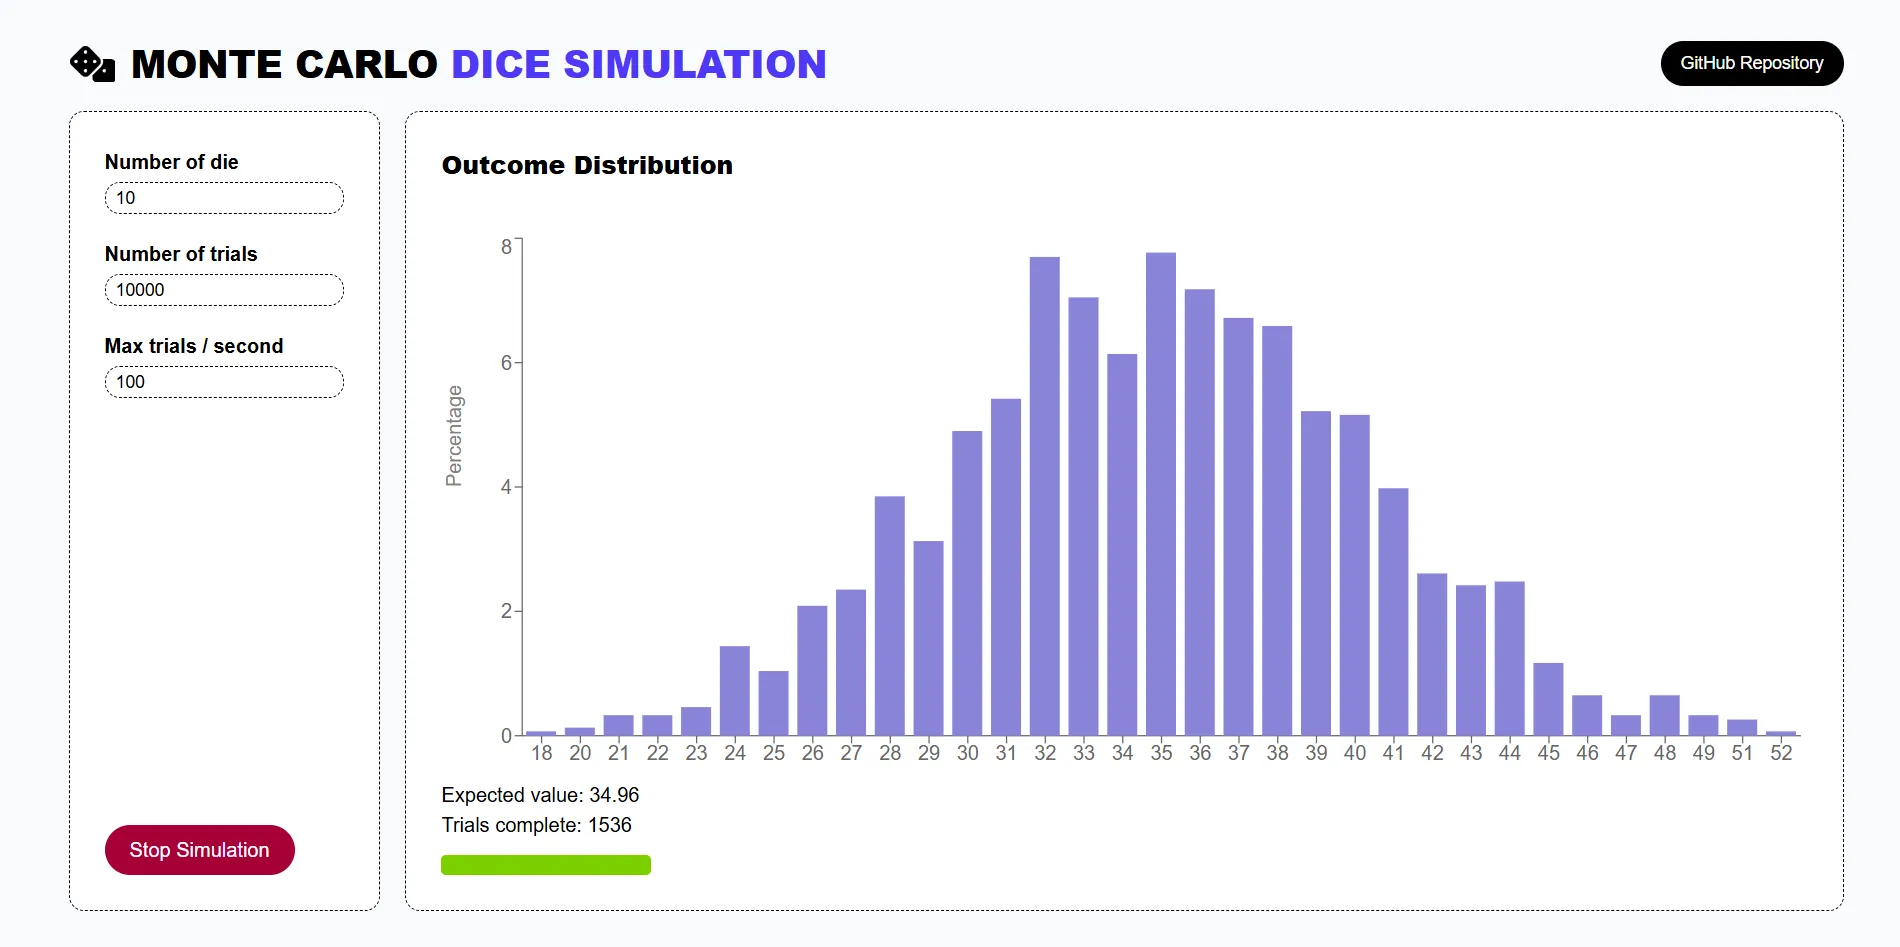
🔗 Monte Carlo Dice Sandbox
This interactive tool allows you to experiment with probability distributions by rolling different numbers of dice and observing the results.
🔢 What is a Monte Carlo Simulation?
A Monte Carlo simulation is a computational method that uses random sampling to estimate the probabilities of different outcomes. Instead of calculating exact probabilities mathematically, we simulate thousands (or millions) of trials and use the results to approximate probabilities.
You can think of it as a “brute-force” approach to determining probabilities.
Monte Carlo methods are widely used in finance, physics, engineering, and AI, where analytical solutions are complex or infeasible.
📌 When is a Monte Carlo Simulation Useful?
Monte Carlo simulations are particularly useful when:
- A problem is too complex for an exact solution (e.g., calculating stock price fluctuations, risk analysis, or game probability modeling).
- The system involves randomness (e.g., simulating dice rolls, predicting weather patterns, or analyzing casino games).
- We want to estimate probabilities experimentally rather than deriving them from formulas.
By running thousands of trials, Monte Carlo methods help reveal emerging statistical patterns.
🎯 Purpose of This Tool
The Monte Carlo Dice Simulation is designed as an interactive learning tool. Instead of dealing with formulas and equations, you can observe probability distributions in action.
It allows you to:
- Roll different numbers of dice and see how distributions change.
- Control the number of trials and watch probabilities converge.
- Adjust the simulation speed to see results dynamically.
📊 Understanding Probability Distributions
One of the coolest things about this tool is how it visually demonstrates probability distributions:
🎲 Rolling One Die: A Uniform Distribution
If we roll a single 6-sided die, each outcome (1 to 6) is equally likely. Running the simulation will show a flat (uniform) probability distribution, meaning every number appears about the same number of times.
🎲🎲 Rolling Two Dice: A Normal Distribution Emerges
As soon as we roll two dice, the sum of their values forms a bell-shaped curve:
- The lowest sum (2) and highest sum (12) are least likely.
- Middle values like 6, 7, and 8 appear more frequently because there are more ways to obtain them.
This is an example of the central limit theorem in action—as we add more dice, the sum of their rolls starts approximating a normal distribution.
🎲🎲🎲 Adding More Dice: A Stronger Bell Curve
With each additional die, the bell shape becomes more pronounced. The more dice we roll, the closer the distribution gets to a true normal distribution.
Try it yourself: Start with one die, then increase the number and observe how the probability distribution changes!
Note, these patterns will not be perfect as random number generators are not truly random - but that’s a conversation for another day!
🔄 Iterations and Convergence
Monte Carlo simulations are based on repeated trials. The more trials we run:
- The closer we get to the true probability distribution.
- The less randomness affects our results.
If we only run a few trials, the distribution might look erratic. But as we increase the number of iterations, the probabilities converge to their expected values.
A useful optimization for this tool could be early stopping—automatically stopping the simulation once the probabilities stabilize.
⏳ Adjusting the Simulation Rate
The tool also allows you to adjust the simulation rate. Slowing it down makes it easier to observe how probabilities change in real time. Speeding it up allows the simulation to converge faster.
🚀 Try It Yourself!
You can experiment with the Monte Carlo Dice Simulation here:
🔗 Monte Carlo Dice Sandbox
Explore different dice configurations, adjust the trial count, and see probability distributions take shape before your eyes!
💡 Final Thoughts
Monte Carlo simulations are a powerful way to model randomness and approximate probabilities. This tool helps visualize key probability concepts, including:
- Uniform distributions (one die)
- Normal distributions (multiple dice)
- Convergence with increased iterations
I hope this tool makes probability more interactive and intuitive! Feel free to reach out with feedback or suggestions. 🚀