Browser Neural Network
Try it out here: https://train-your-own-neural-network.vercel.app/
This web tool allows you to manually train a neural network to perform binary classification on two distinct hand-drawn characters (e.g. X and O).
It serves as a powerful learning tool for anyone getting started with deep learning, providing an almost tactile lesson on the inner workings of a neural network.
What makes this app so cool is that:
- It runs in the browser — no need to install or code anything
- It’s trained entirely by your inputs — no prior training (e.g. MNIST dataset)
- You can actually see the neural network learning in the visualiser
I admit, it is not the most intuitive tool in the world. So I’ve done my best to explain how it works below.
Before and After
When you first load the tool it will look like this:
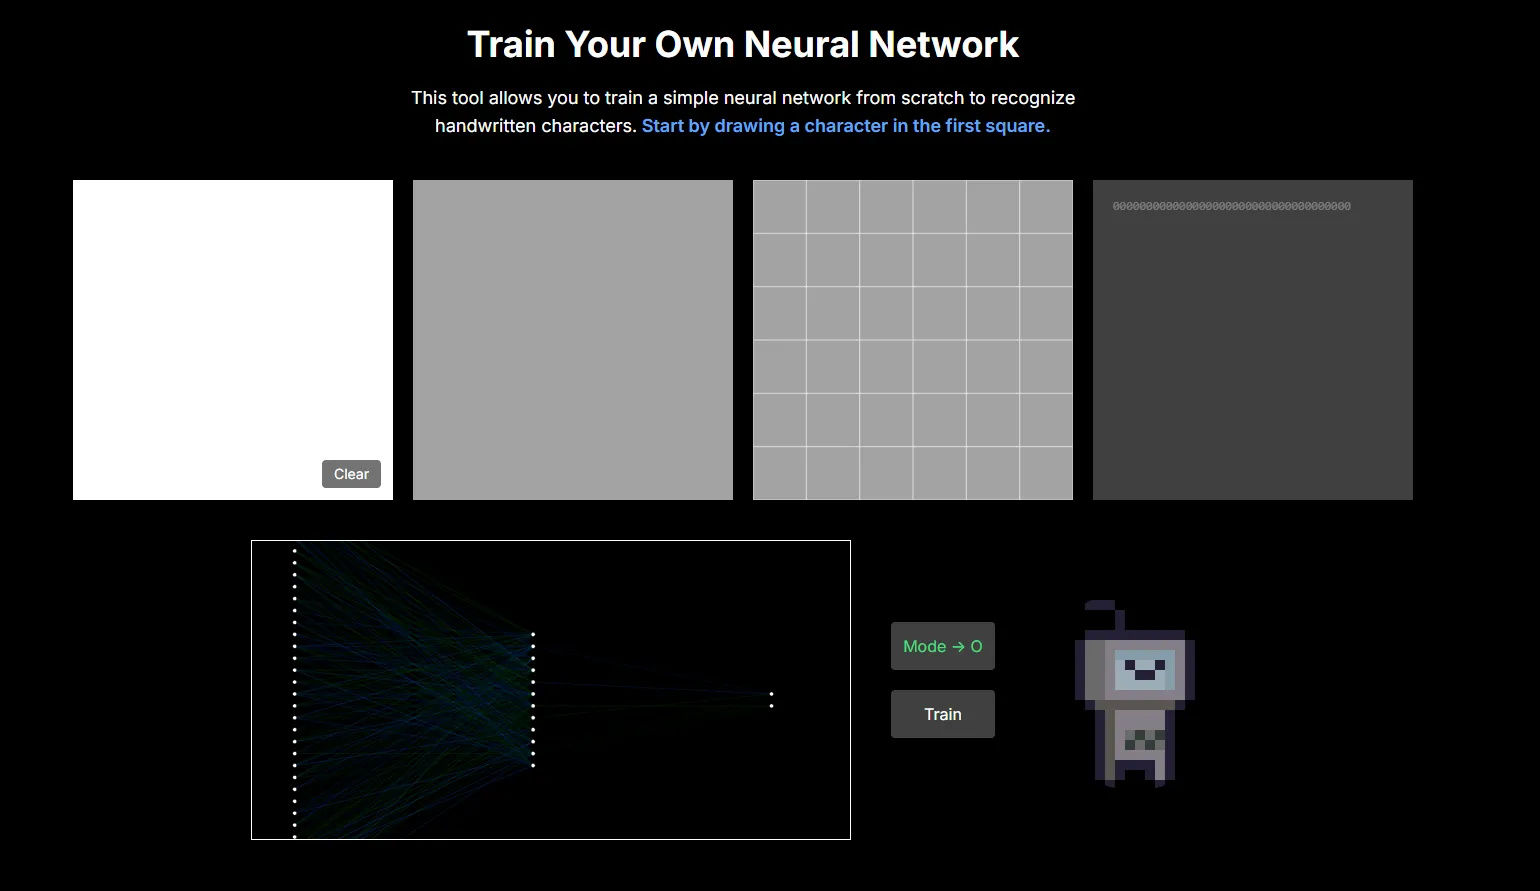
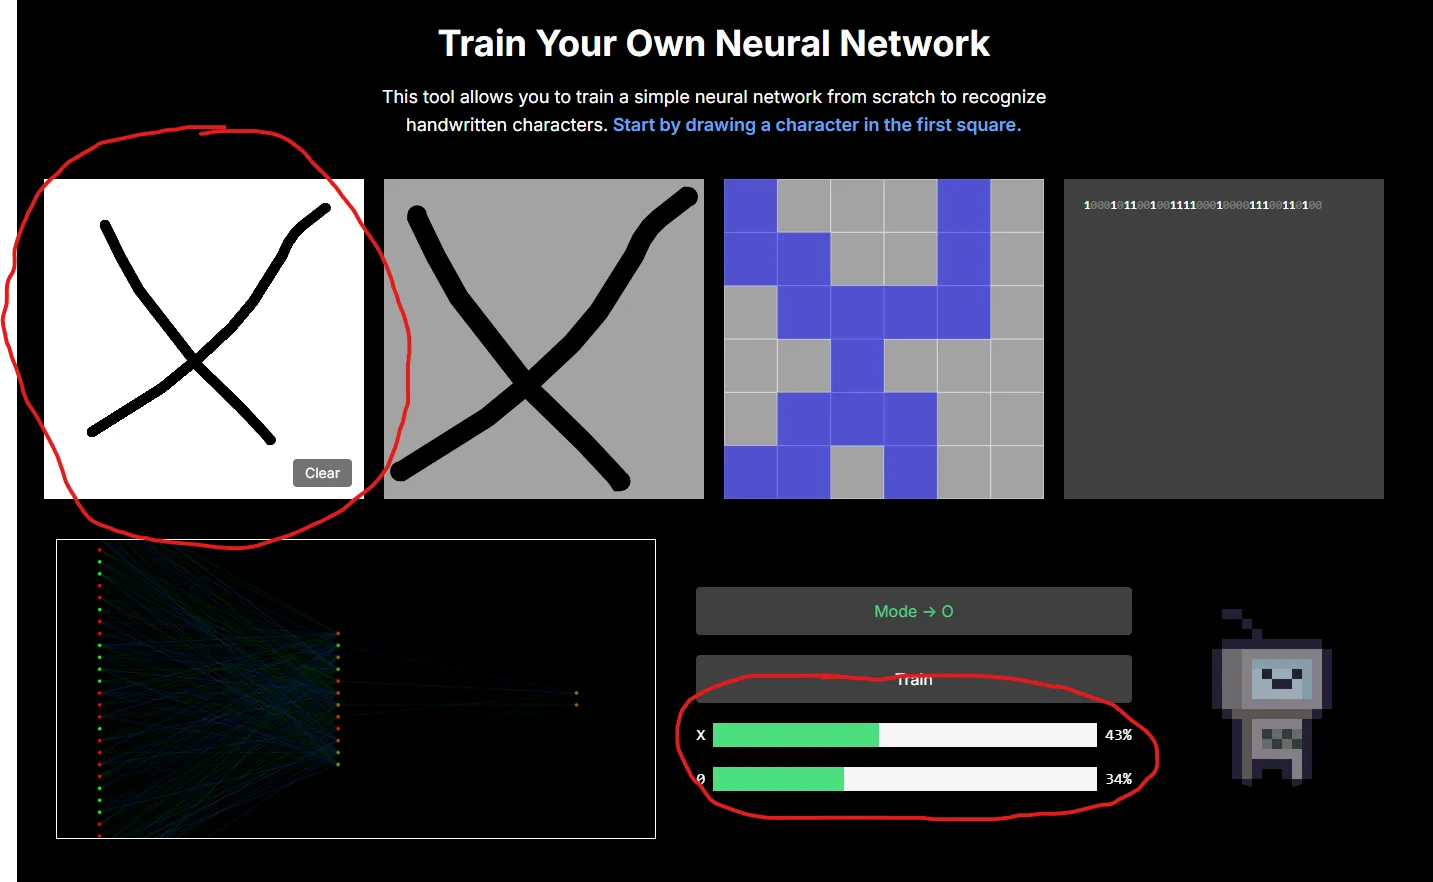
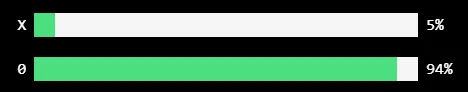
If you draw an X or O in the white square (top left), you’ll see no discernable difference in the prediction probabilities:
This is because right now all the weights and biases in our neural network are random.
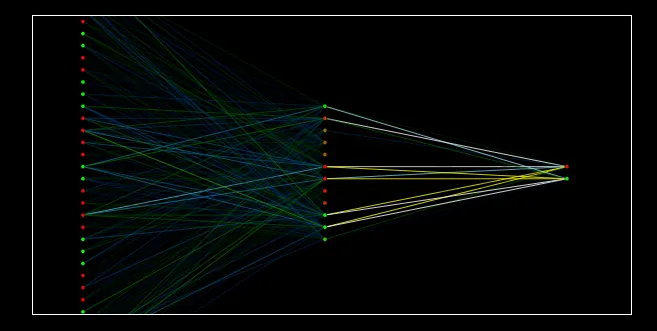
Now lets look at the visualiser (bottom left) that displays the architecture of our neural network and weights of each connection:
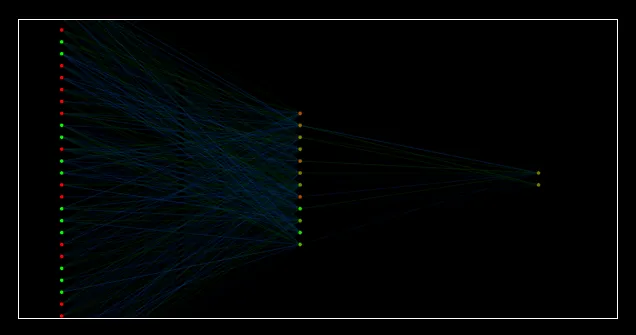
Notice that the connecting lines are very dim. They will become brighter as the model learns patterns in the input data and the weights become stronger.
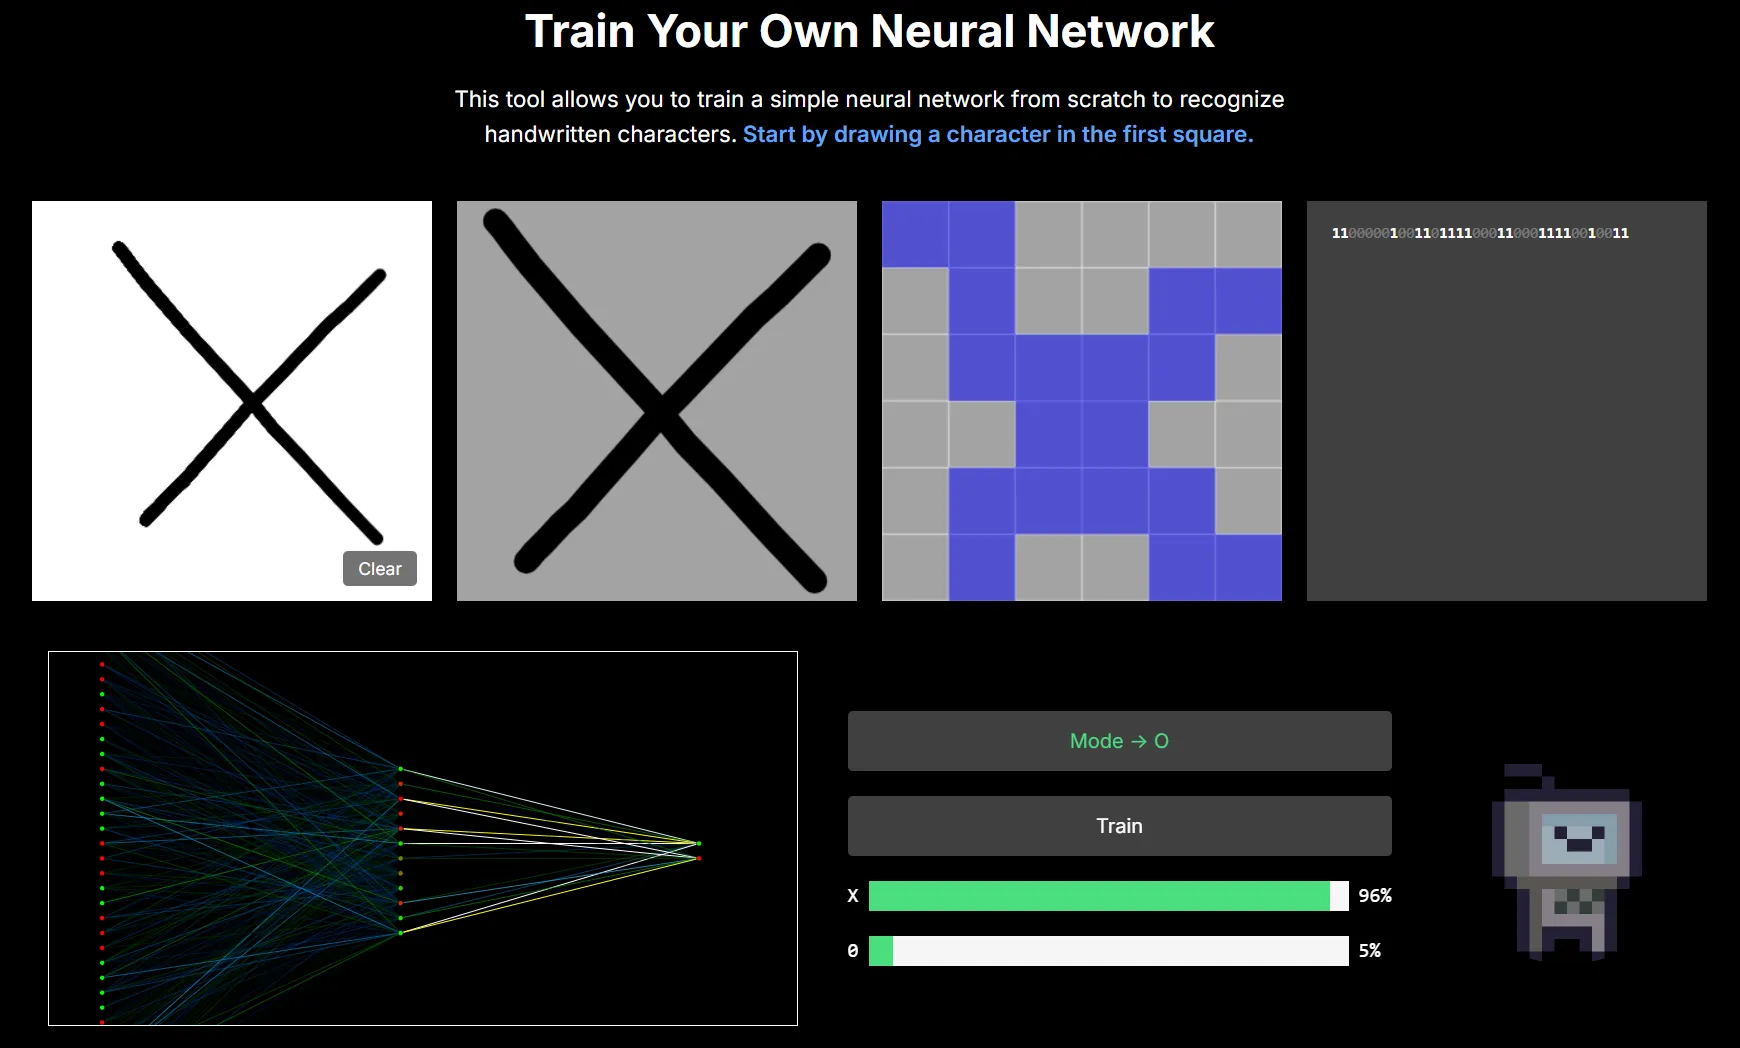
After training:
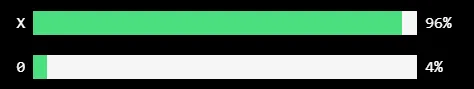
Once your model is trained, it’ll be able to correctly classify Xs and Os with a high degree of accuracy:
And your visualiser should look something like this (with bright lines representing the weights of each connection):
So, how do we get from A to B?
How to train the model
Briefly, this is the sequence you repeat to train the model:
- Look at the character on the mode button (X or O)
- Draw that character in the white square
- Click the
Trainbutton - Click the
Modebutton to switch characters - Repeat from step 1
The model uses stochastic gradient descent meaning it trains the model one sample at a time (rather than on an entire dataset or in batches).
So every time you click train you should see the prediction probabilities and visualiser change as the weights and biases in the model are adjusted.
The sequence described above is the “proper” way to use the tool i.e. you draw one character (e.g. an X), click Train, then switch characters using the Mode button and repeat for the other character (e.g. O). This ensures an even distribution of Xs and Os, and also ensures every sample is unique.
However this is a tedious process, and will take a few minutes before the model starts predicting characters well.
You can train the model FASTER by clicking Train 10 times (instead of just once) for each sample/drawing. This method will have your model working well in under a minute.
Just be aware this is NOT correct practise, as you are essentially creating duplicate samples — but for the purposes of testing the tool it works well.
Further considerations
- You do not have to train on “X” and “O”, you could do ”—” and ”|” for example. Just make sure your two characters are distinct
- The
Modebutton has no effect on the predictions shown. Essentially it’s just a tool for labelling drawings/samples during training
How it works - Input
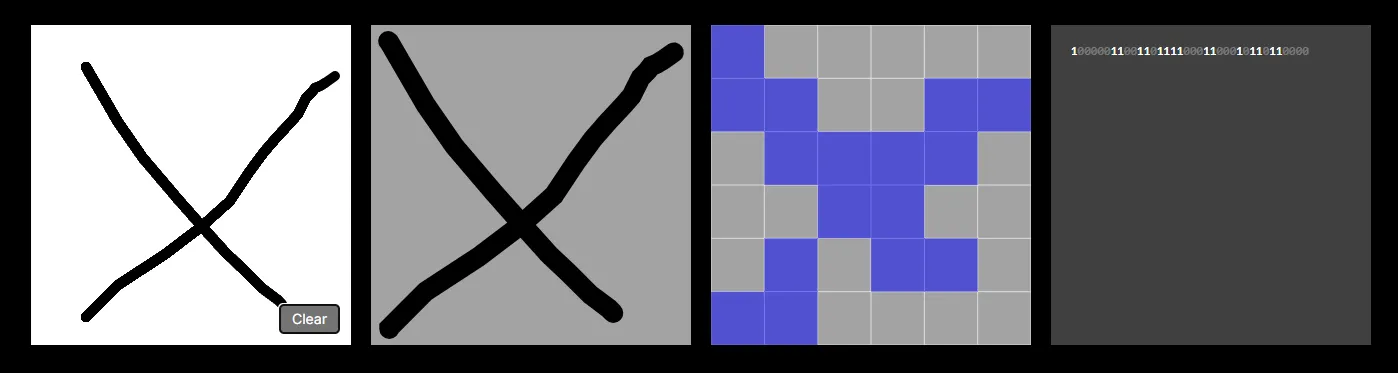
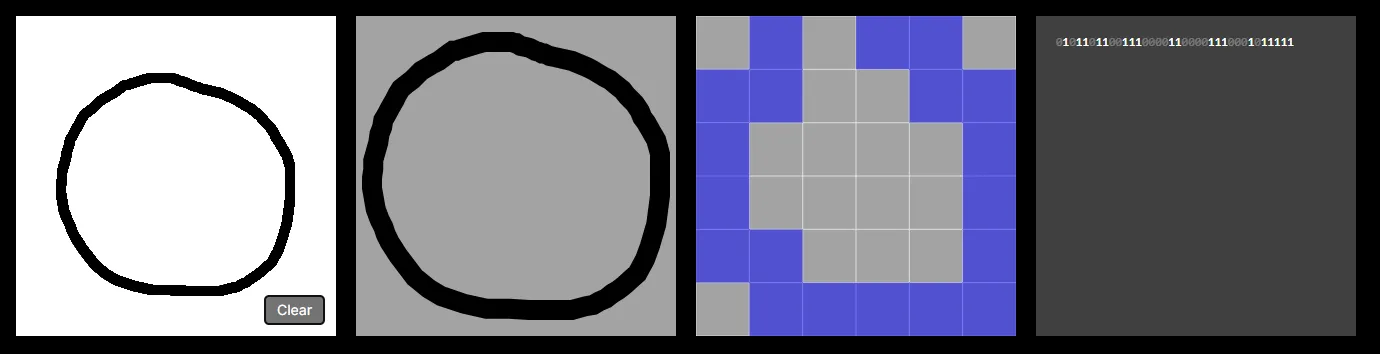
Let’s start by talking about the row of four squares at the top of the screen. The 1st window, as you know, is where you create samples by drawing characters.
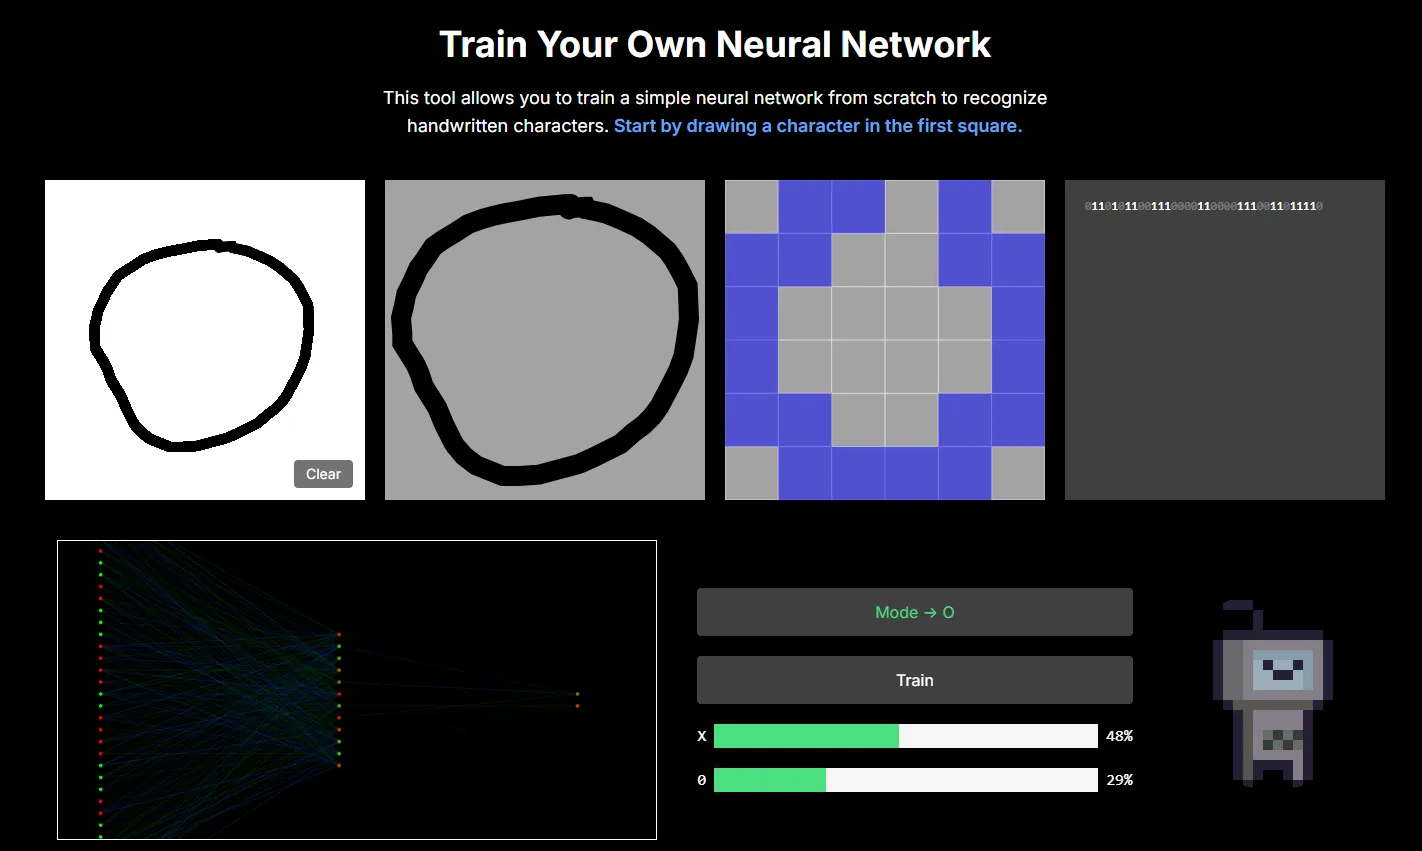
The 2nd window essentially “normalises” the position and scale of the drawing to fill an entire square. Notice no matter where or how big you draw your character, it fills the entire second square.
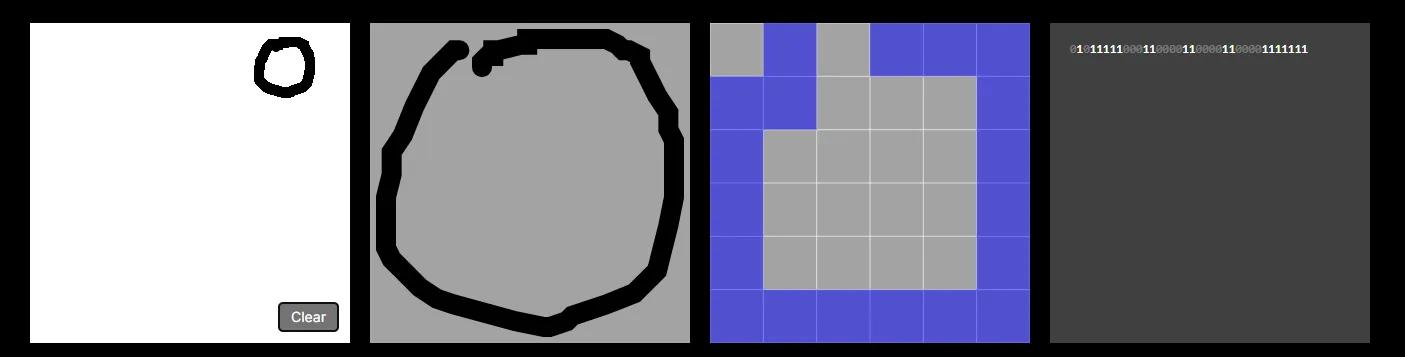
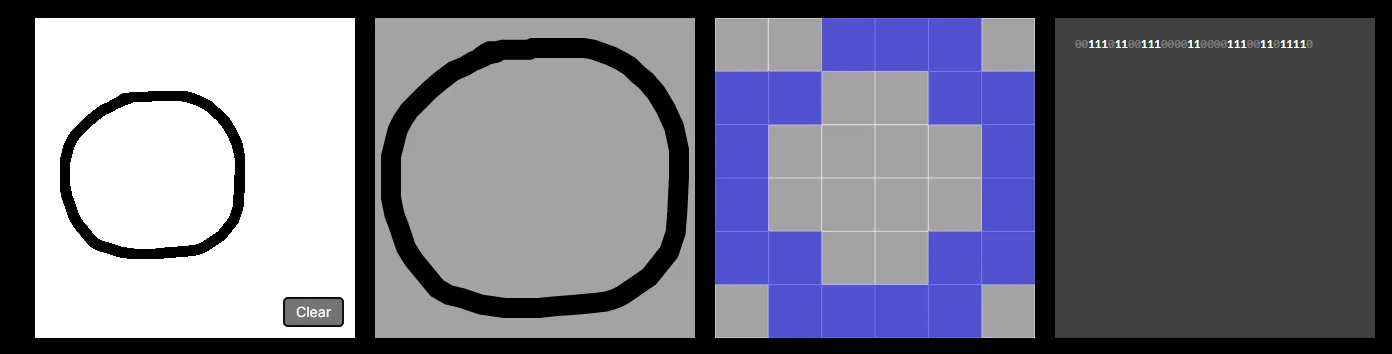
The 3rd window rasterizes the drawing into a 6x6 bitmap — essentially an image where each pixel has a value of either 1 or 0. In theory, we could improve the capabilities of our model by increasing the dimensions e.g. to 28 x 28. However, each new pixel would require its own input neuron, increasing the computational costs of the model. And as the tool runs entirely in the browser we need to keep computational costs low otherwise the page crashes.
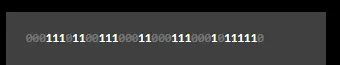
The 4th window displays the image as a bit string of its underlying 1s and 0s — remember, this is the input data that will be passed into our neural network. Again, each bit correlates to a neuron in the input layer of the neural network. See below:
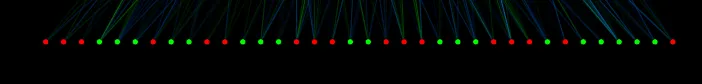
(I’ve rotated the input layer in the visualiser 90° anti-clockwise, to make it easier to see)
The colours indicate the activation of each neuron — green indicates a value of 1 and red indicates a value of 0. Our input data only contains values of 1 and 0, so in the input layer each neuron will be either green or red. See how this correlates to the input bit string?
In the hidden and output layers the activations can be between 1 and 0, so you’ll see some orange-brown coloured neurons there.
How it works - Model
The app uses a custom implementation of a simple feed-forward neural network, specifically a Multilayer Perceptron.
In this type of neural network, each neuron is connected to every neuron in the next layer and uses activation functions to learn non-linear patterns in data.
My model has 3 layers.
- An input layer with 36 neurons (correlating to the 6x6 bitmap)
- A hidden layer with 12 neurons (arbitrarily chosen) for learning general patterns in the data e.g. curves and shapes
- An output layer with 2 neurons (correlating to the two possible characters e.g. X or O)
You can see all of this in the neural network visualiser.